網上版請按此
Looking forward to HK's next level of smart city development
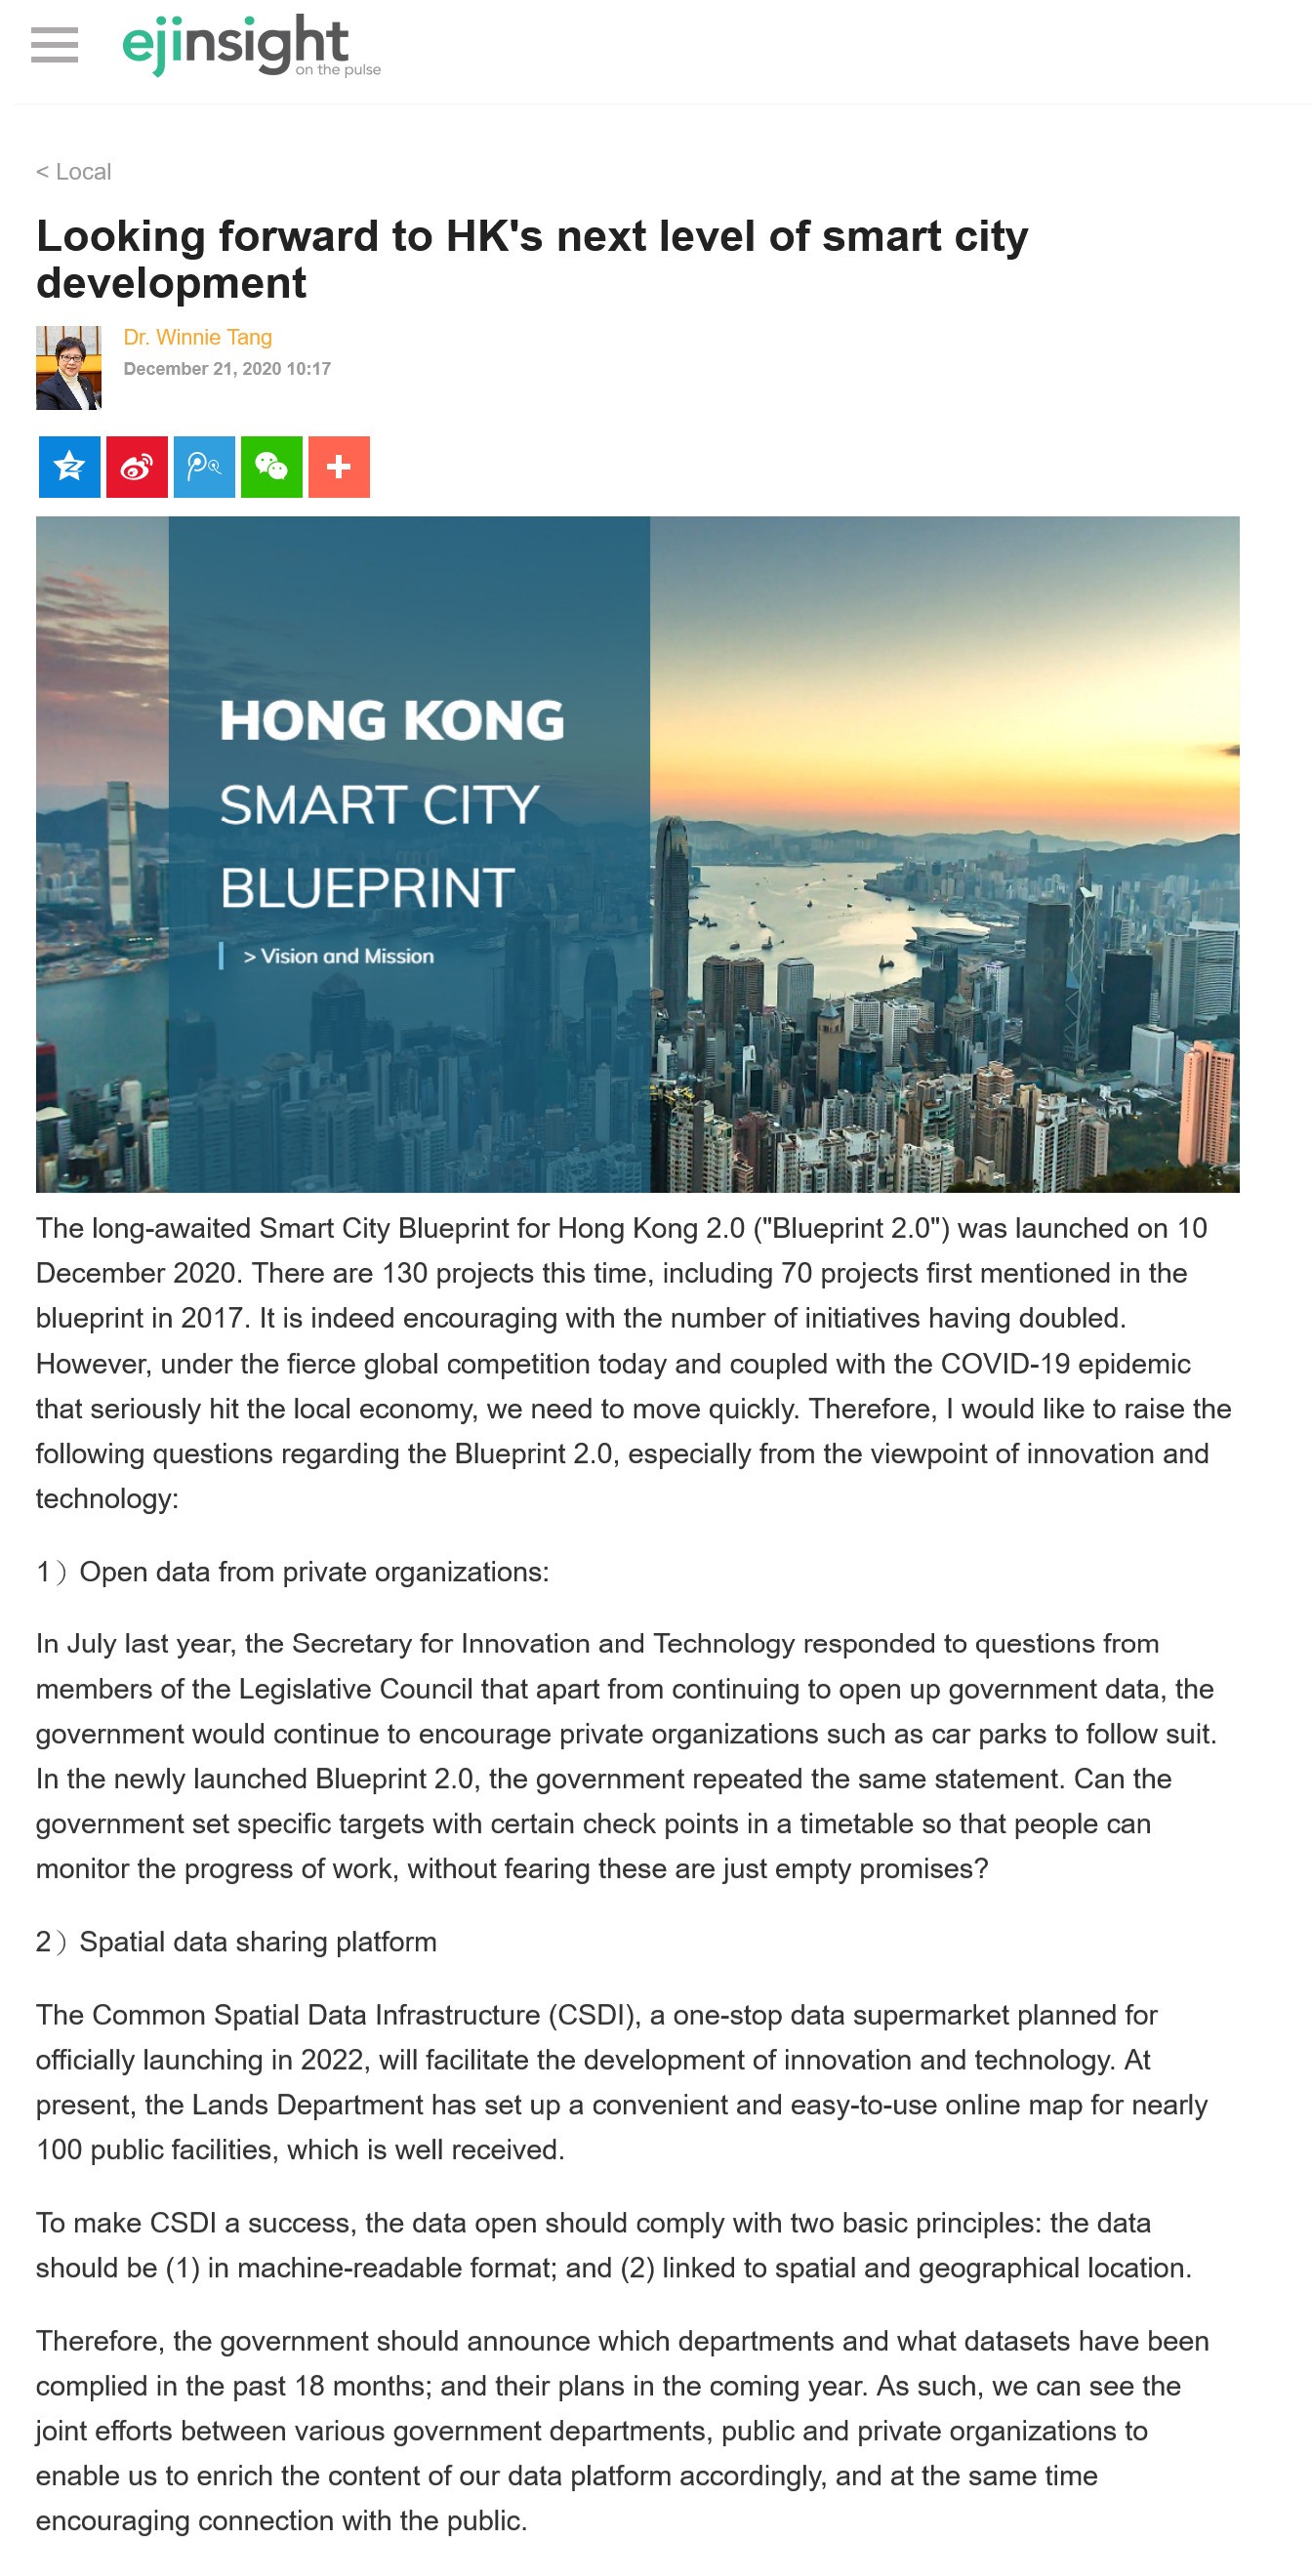
The long-awaited Smart City Blueprint for Hong Kong 2.0 ("Blueprint 2.0") was launched on 10 December 2020. There are 130 projects this time, including 70 projects first mentioned in the blueprint in 2017. It is indeed encouraging with the number of initiatives having doubled. However, under the fierce global competition today and coupled with the COVID-19 epidemic that seriously hit the local economy, we need to move quickly. Therefore, I would like to raise the following questions regarding the Blueprint 2.0, especially from the viewpoint of innovation and technology:
1)Open data from private organizations:
In July last year, the Secretary for Innovation and Technology responded to questions from members of the Legislative Council that apart from continuing to open up government data, the government would continue to encourage private organizations such as car parks to follow suit. In the newly launched Blueprint 2.0, the government repeated the same statement. Can the government set specific targets with certain check points in a timetable so that people can monitor the progress of work, without fearing these are just empty promises?
2)Spatial data sharing platform
The Common Spatial Data Infrastructure (CSDI), a one-stop data supermarket planned for officially launching in 2022, will facilitate the development of innovation and technology. At present, the Lands Department has set up a convenient and easy-to-use online map for nearly 100 public facilities, which is well received.
To make CSDI a success, the data open should comply with two basic principles: the data should be (1) in machine-readable format; and (2) linked to spatial and geographical location.
Therefore, the government should announce which departments and what datasets have been complied in the past 18 months; and their plans in the coming year. As such, we can see the joint efforts between various government departments, public and private organizations to enable us to enrich the content of our data platform accordingly, and at the same time encouraging connection with the public.
3)Interactive Map Dashboard
When the COVID-19 broke out in early February this year, rumours spread everywhere. Our group of information technology volunteers assisted the government in launching an interactive map dashboard of the epidemic. The map and figures make it easy for the public to understand the latest situation and grasp the true information, it was well received by the public.
Dashboards have been added to the Blueprint 2.0 website according to each of the smart city category which is mobility, living, environment, people, government and economy, but they do not completely fulfil the objectives of Blueprint 2.0.
For example, the objectives of the "Smart People" measures are to promote STEM (science, technology, engineering and mathematics) education, enhance scientific research capability, and promote entrepreneurship and innovation. However, only "Number of Persons Engaged Discharging Information Technology-Related Job Duties by Educational Attainment" and "Number of R&D Personnel" on the dashboard are related to "Smart People", others like "Educational and Training Institutions by Level of Education" are clearly not the focus.
I suggest adding the following information:
ICT work
1. Number of persons employed in information and communication technology (ICT) sector (increase and decrease in high-tech industry such as electronics, biotechnology, telecommunications, as well as non-ICT companies);
2. Number of students enrolled in STEM courses in post-secondary education and the ratio of males to females;
3. Number of ICT/knowledge workers who immigrated from overseas and emigrated to other places;
4. Number of scientists, researchers and engineers.
Innovation capacity
1. Detail information of each youth entrepreneurial fund and scheme, such as investment amount, number of participants, number of new startups and job positions, and subsequent success rate (e.g. number of companies that last for several years or are acquired);
2. Updates of reindustrialization, such as investment, productivity, income, job vacancies, etc;
3. Number of major scientific and technological projects, number of successful patent applications;
4. Investment in scientific research by ICT and non-ICT industry.
Ideally, the above information shall reflect the situation of the past 5 to 10 years, allowing people to view the changes. As such, the dashboard not only facilitates the public to keep abreast of the latest development in innovation and technology, but it also measures whether the local economy matches the ideal structure of the innovation-driven new economy.
In this way, we can work in a concerted manner to promote Hong Kong's innovation and technology and the new economy. This will help promote public participation and take Hong Kong's smart city development to the next level.
Dr. Winnie Tang
Adjunct Professor, Department of Computer Science, Faculty of Engineering; Department of Geography, Faculty of Social Sciences; and Faculty of Architecture, The University of Hong Kong