網上版請按此
Ventilation of the Tokyo Olympic Stadium
The outstanding performance of Hong Kong athletes in the Tokyo Olympic Games has made Hong Kong excited. Not long ago, the public was worried about holding large-scale gatherings under the COVID-19 epidemic, it seems that we all forgot about the worry for the time being.
In March this year, the World Health Organization proposed a roadmap to improve indoor ventilation in the context of COVID-19 to reduce the risk of spreading the virus. However, the air that flows through outdoor and semi-outdoor areas, such as bus stops, stadiums, and playgrounds, is intricate. It is not easy to objectively evaluate whether there is enough airflow in these places.
In the past, this kind of fluid simulation required enormous computing resources, the related professional software could cost millions of dollars. In recent years, the Kyushu University of Japan has used computational fluid dynamics (CFD) to simulate the ventilation of outdoor and semi-outdoor spaces, combining the use of geographic information system (GIS) to integrate data of 3D city model, terrain and building information modelling (BIM) for analysing airflow. The results are then displayed on a map, which is clear at a glance.
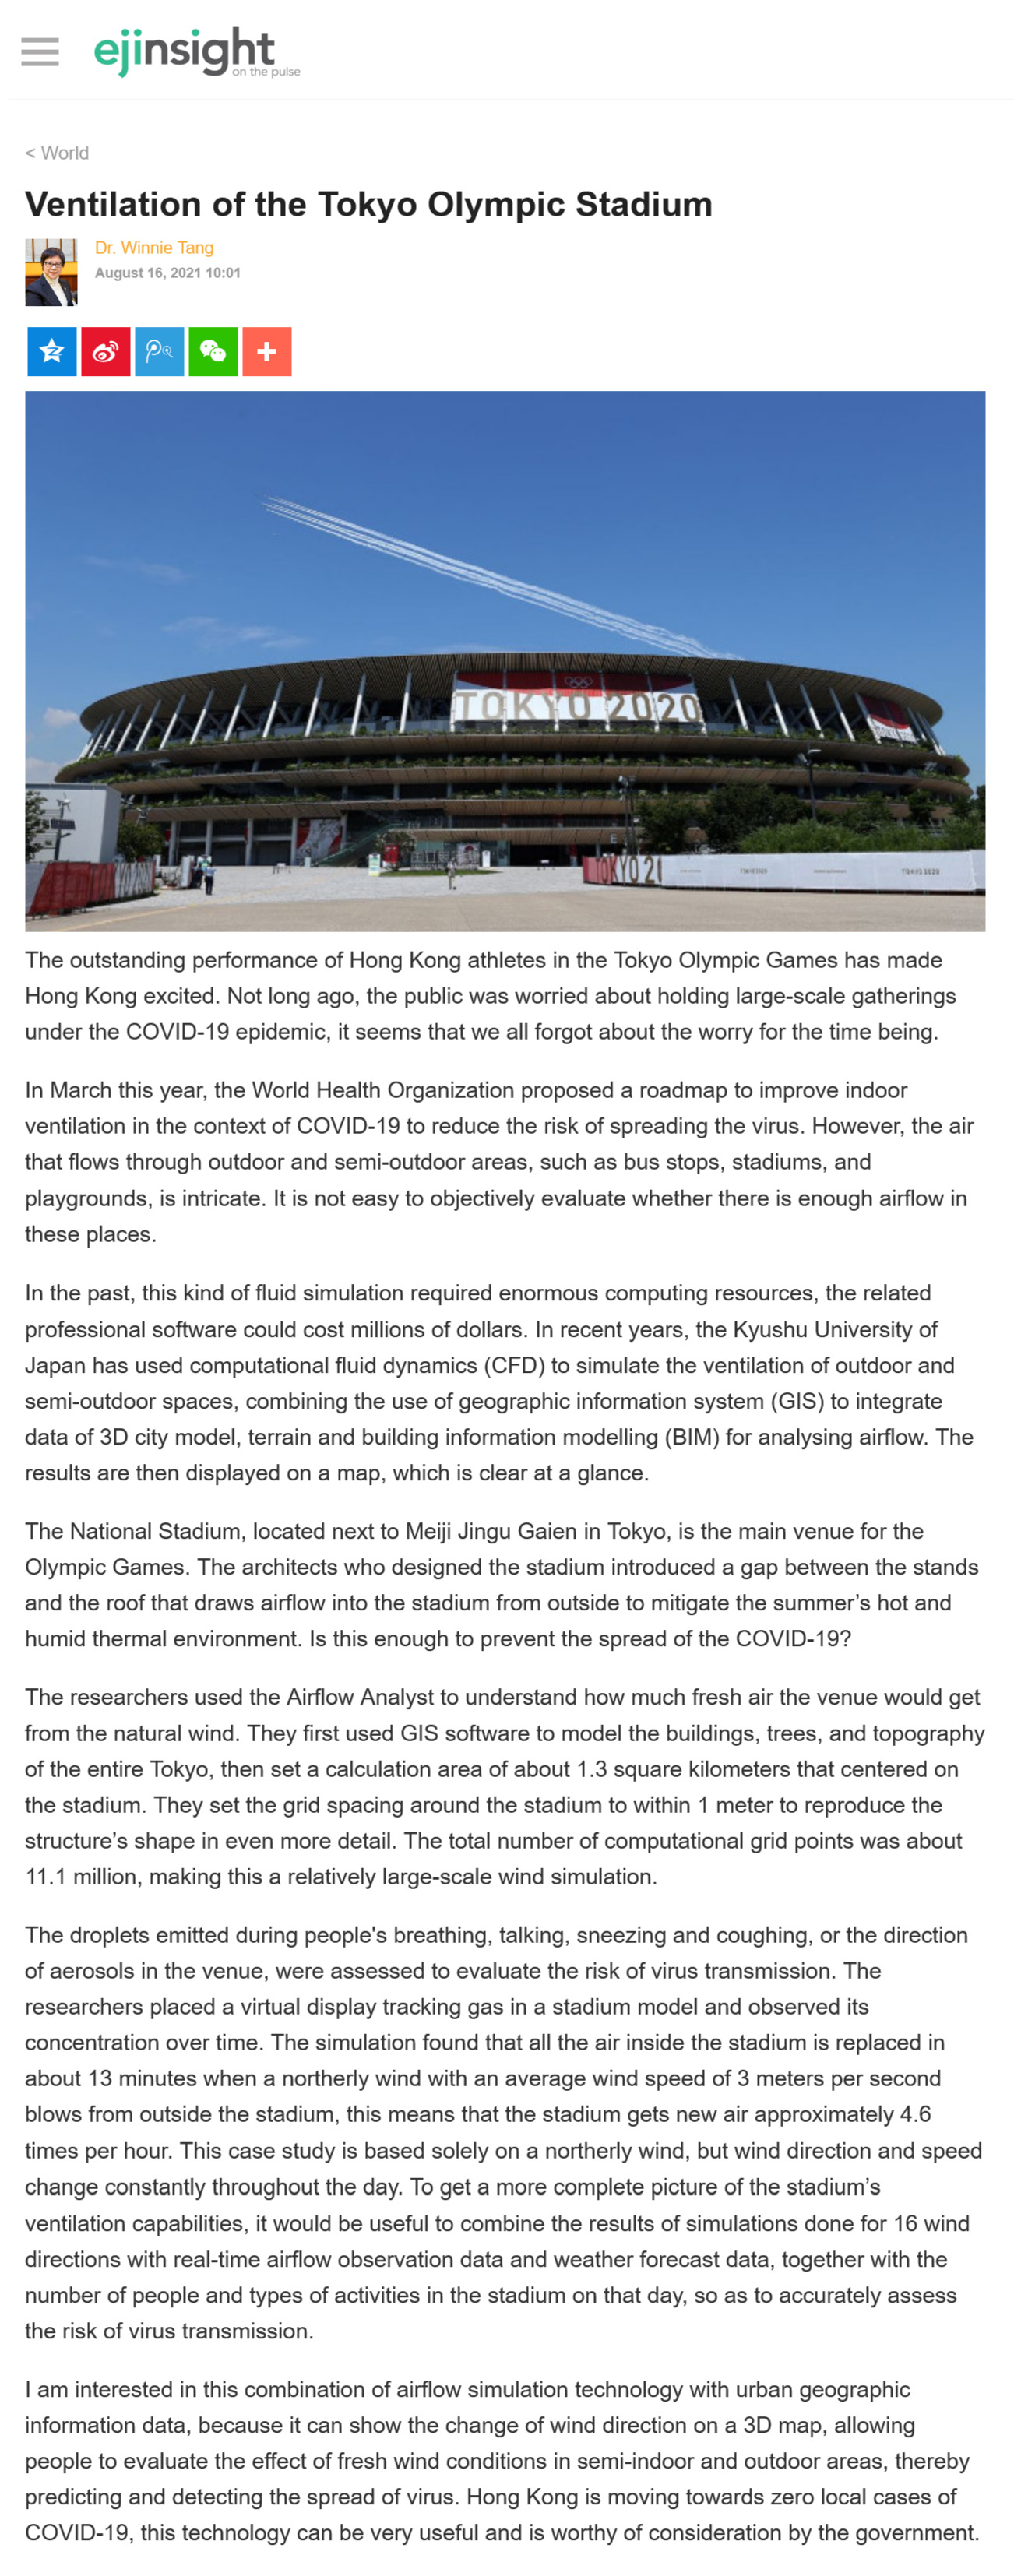
The National Stadium, located next to Meiji Jingu Gaien in Tokyo, is the main venue for the Olympic Games. The architects who designed the stadium introduced a gap between the stands and the roof that draws airflow into the stadium from outside to mitigate the summer's hot and humid thermal environment. Is this enough to prevent the spread of the COVID-19?
The researchers used the Airflow Analyst to understand how much fresh air the venue would get from the natural wind. They first used GIS software to model the buildings, trees, and topography of the entire Tokyo, then set a calculation area of about 1.3 square kilometers that centered on the stadium. They set the grid spacing around the stadium to within 1 meter to reproduce the structure's shape in even more detail. The total number of computational grid points was about 11.1 million, making this a relatively large-scale wind simulation.
The droplets emitted during people's breathing, talking, sneezing and coughing, or the direction of aerosols in the venue, were assessed to evaluate the risk of virus transmission. The researchers placed a virtual display tracking gas in a stadium model and observed its concentration over time. The simulation found that all the air inside the stadium is replaced in about 13 minutes when a northerly wind with an average wind speed of 3 meters per second blows from outside the stadium, this means that the stadium gets new air approximately 4.6 times per hour. This case study is based solely on a northerly wind, but wind direction and speed change constantly throughout the day. To get a more complete picture of the stadium's ventilation capabilities, it would be useful to combine the results of simulations done for 16 wind directions with real-time airflow observation data and weather forecast data, together with the number of people and types of activities in the stadium on that day, so as to accurately assess the risk of virus transmission.
I am interested in this combination of airflow simulation technology with urban geographic information data, because it can show the change of wind direction on a 3D map, allowing people to evaluate the effect of fresh wind conditions in semi-indoor and outdoor areas, thereby predicting and detecting the spread of virus. Hong Kong is moving towards zero local cases of COVID-19, this technology can be very useful and is worthy of consideration by the government.
Dr. Winnie Tang
Adjunct Professor, Department of Computer Science, Faculty of Engineering; Department of Geography, Faculty of Social Sciences; and Faculty of Architecture, The University of Hong Kong